Welcome to my July real estate market report! In this monthly series, I examine the real estate market data, school district by school district, here in Chester County. From Oxford to Tredyffrin/Easttown, and everywhere in between, the entire county will be covered over the next 12 months.
National headlines, averages, and talking points make for entertaining coverage, though do little to help you get a picture of real estate in your neighborhood. That’s where local, up-to-the-minute information really comes in. Even this snapshot of a school district in our county casts a wide net. All the same, this picture can help build a foundation for those more focused comparisons and conversations with real estate agents.
This month, I’m switching up the format. Rather than dull numbers focusing on a very narrow timeframe, I’m bringing you my insights on the entire past year’s activity. For a breakdown of the industry jargon I use throughout the article, and the month-sized snapshots from this past year, head to my Glossary of Terms and Index. I know this can be a lot, so feel free to reach out with any questions.
Kicking off the new format, we’re diving into the data for the school district in our County Seat with the West Chester Area School District (WCASD). With 3 high schools, 3 middle schools, and 11 elementary schools, WCASD has the most schools in our county.
Now, let’s jump into the real estate market stats for the West Chester Area School District from June 2023-June 2024!
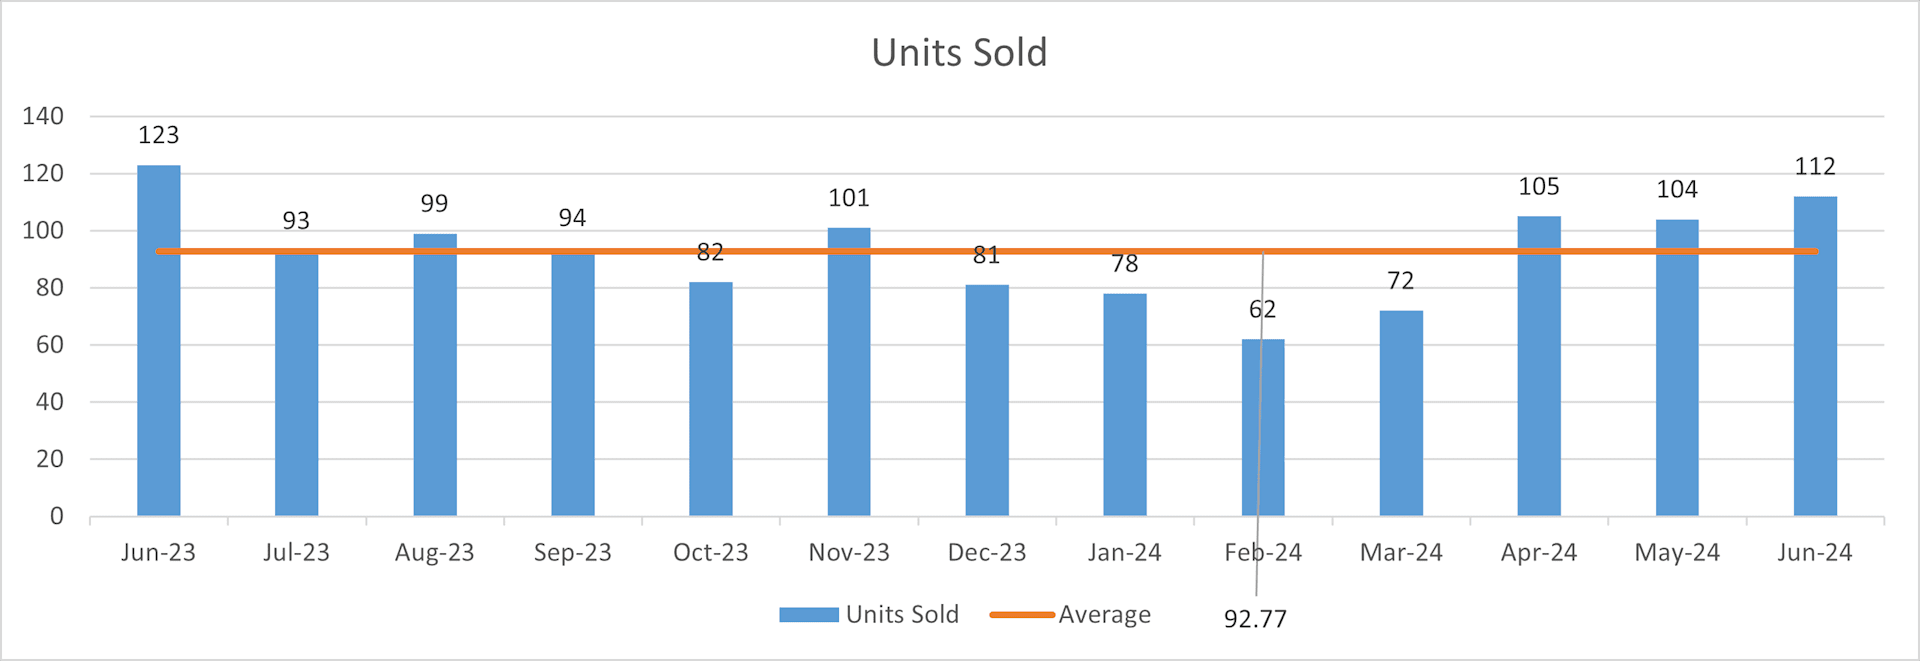
Units Sold
This chart looks at how many homes were sold, month-by-month, with the average overlaid as a line. Analyzing what we see, it’s clear that the spring months saw the most transactions while winter saw a dip in activity. This is a pretty normal trend in our area. The summer months are hot, while the holiday season sees a cooling of activity. By the time April rolls around, winter weather is mostly over, the days are longer, and there’s time to go house hunting again.
*All data ©BrightMLS - Information deemed reliable but not guaranteed. Data run 7/12/24.
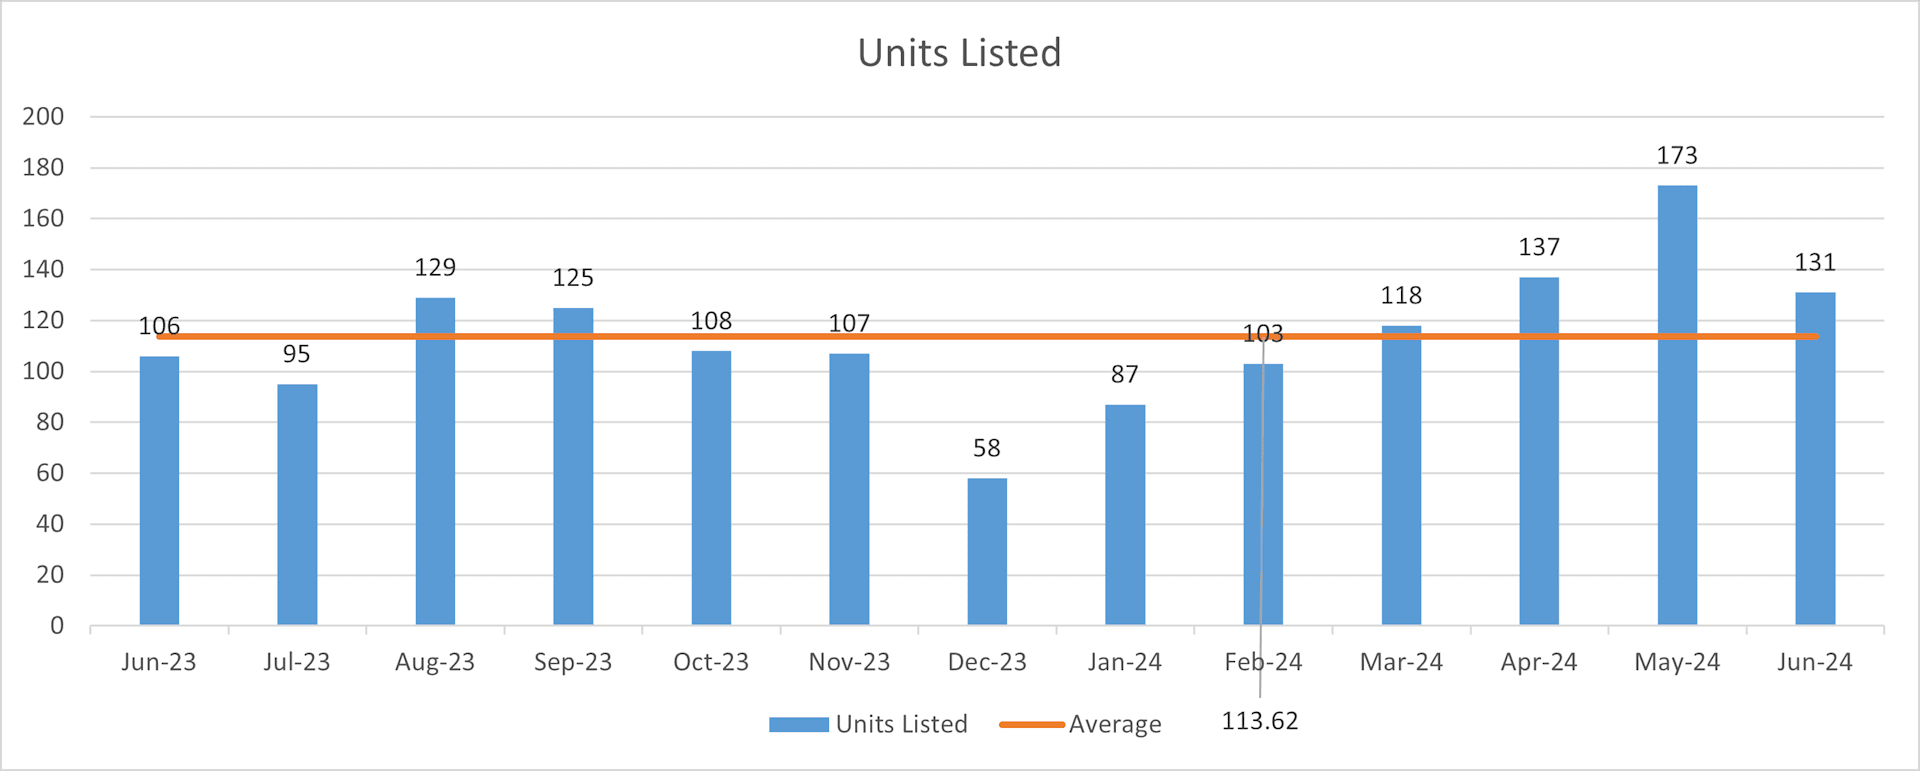
Units Listed
Here we take a look at how many units were listed, month-by-month, across WCASD. As expected, the summer months and spring market saw the highest number of new listings this past year. Likewise, December saw the lowest number of listings. Such clear signs of “normal” market activity are welcome after several unbalanced years. If trends continue as-is, we can expect listings to remain strong for the next few months before dropping off as winter rolls in.
*All data ©BrightMLS - Information deemed reliable but not guaranteed. Data run 7/12/24.
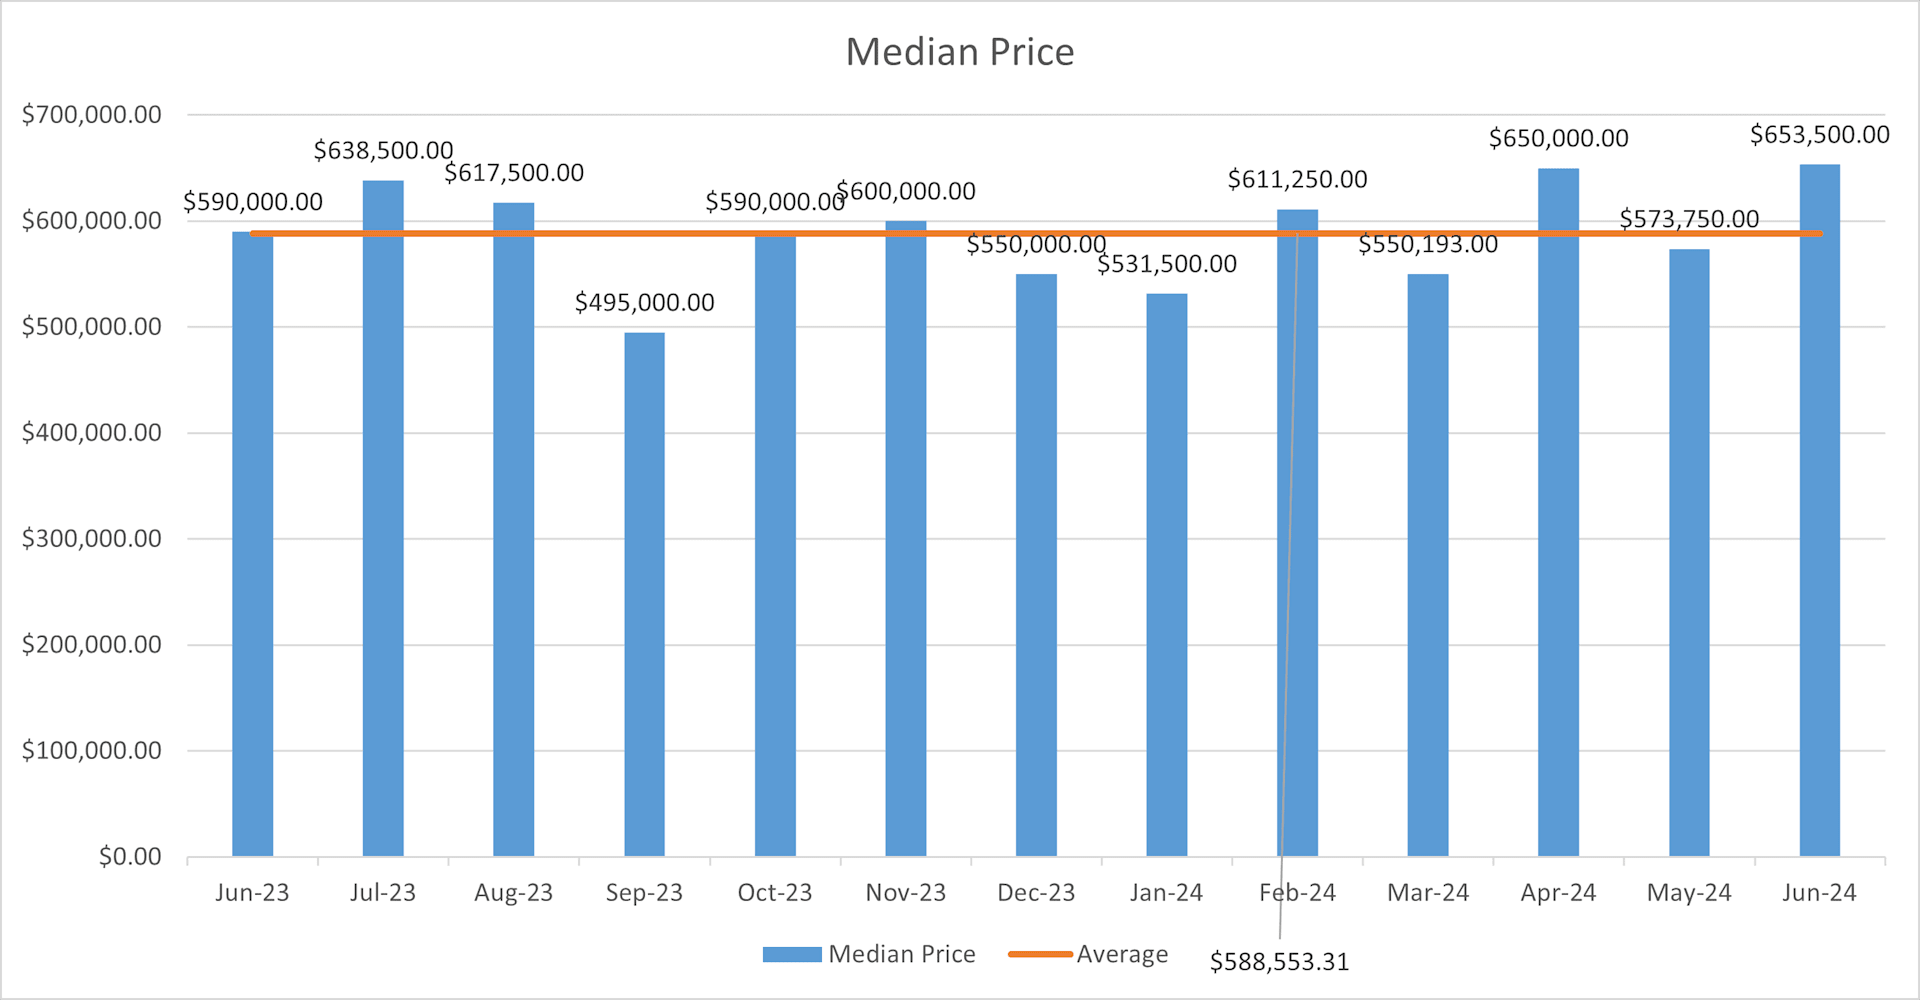
Median Sold Price
Over the past year, home prices have remained rather stable across WCASD. This month, we're at the highest median sale price, $64,946.69 above the year’s average median. The lowest dip came in September, $93,553.31 under the year’s average median. Prices from this time last year are just about the average median price, only $1,446.69 higher than the year’s average median sale price. All in all, a stable year for housing prices in WCASD as prices continue to appreciate at a sustainable rate.
*All data ©BrightMLS - Information deemed reliable but not guaranteed. Data run 7/12/24.
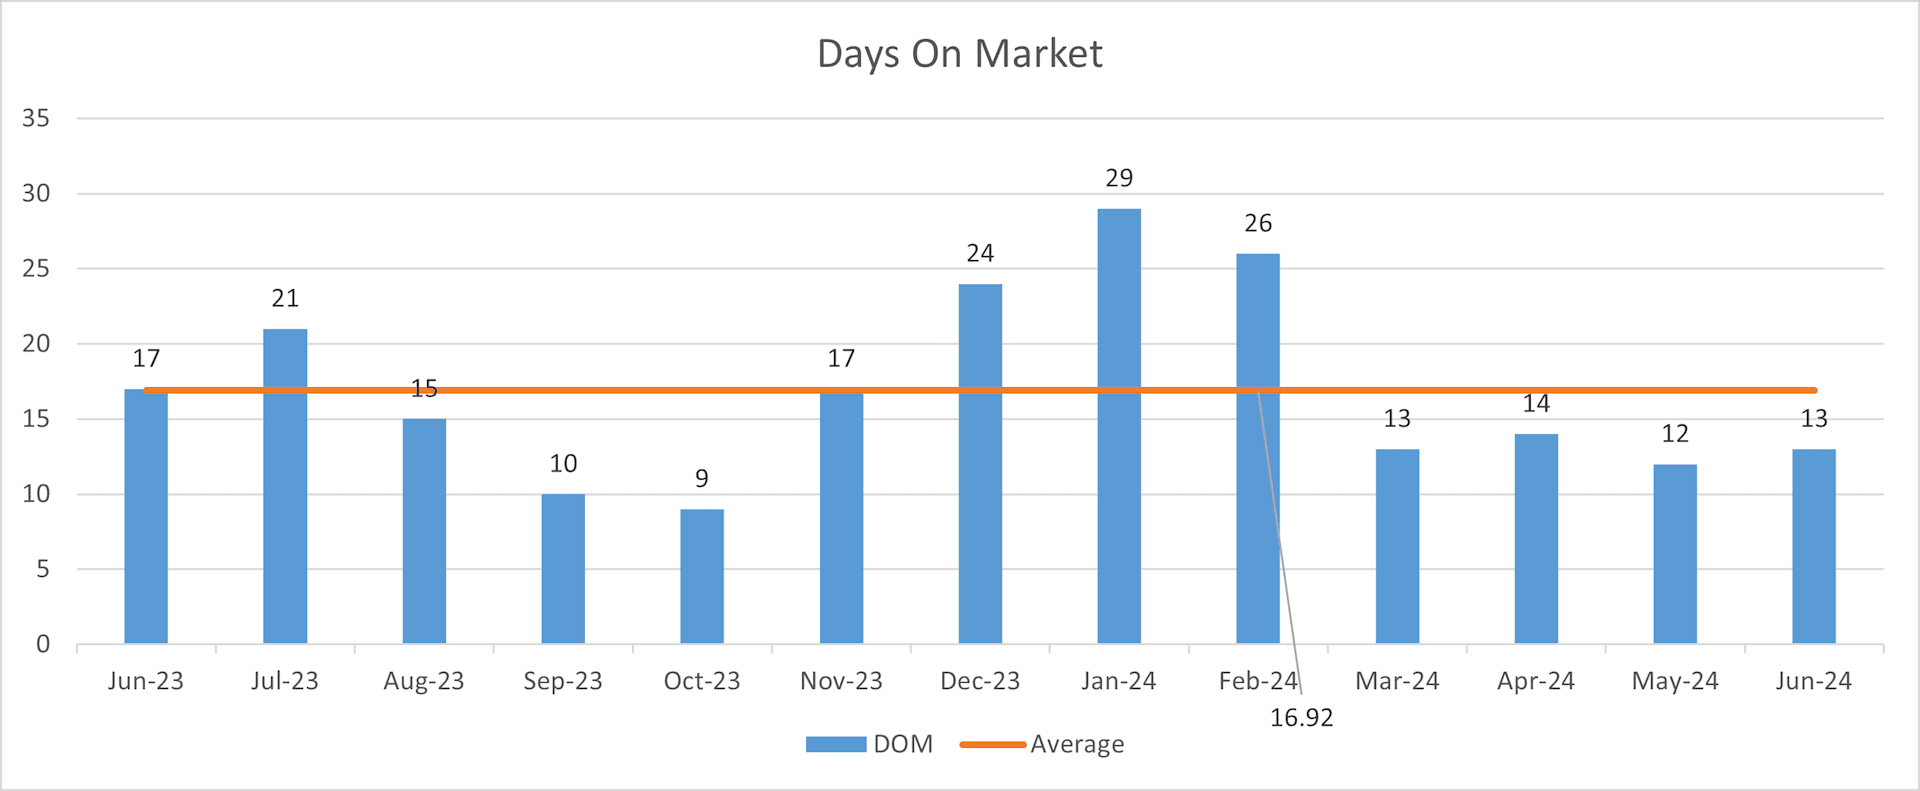
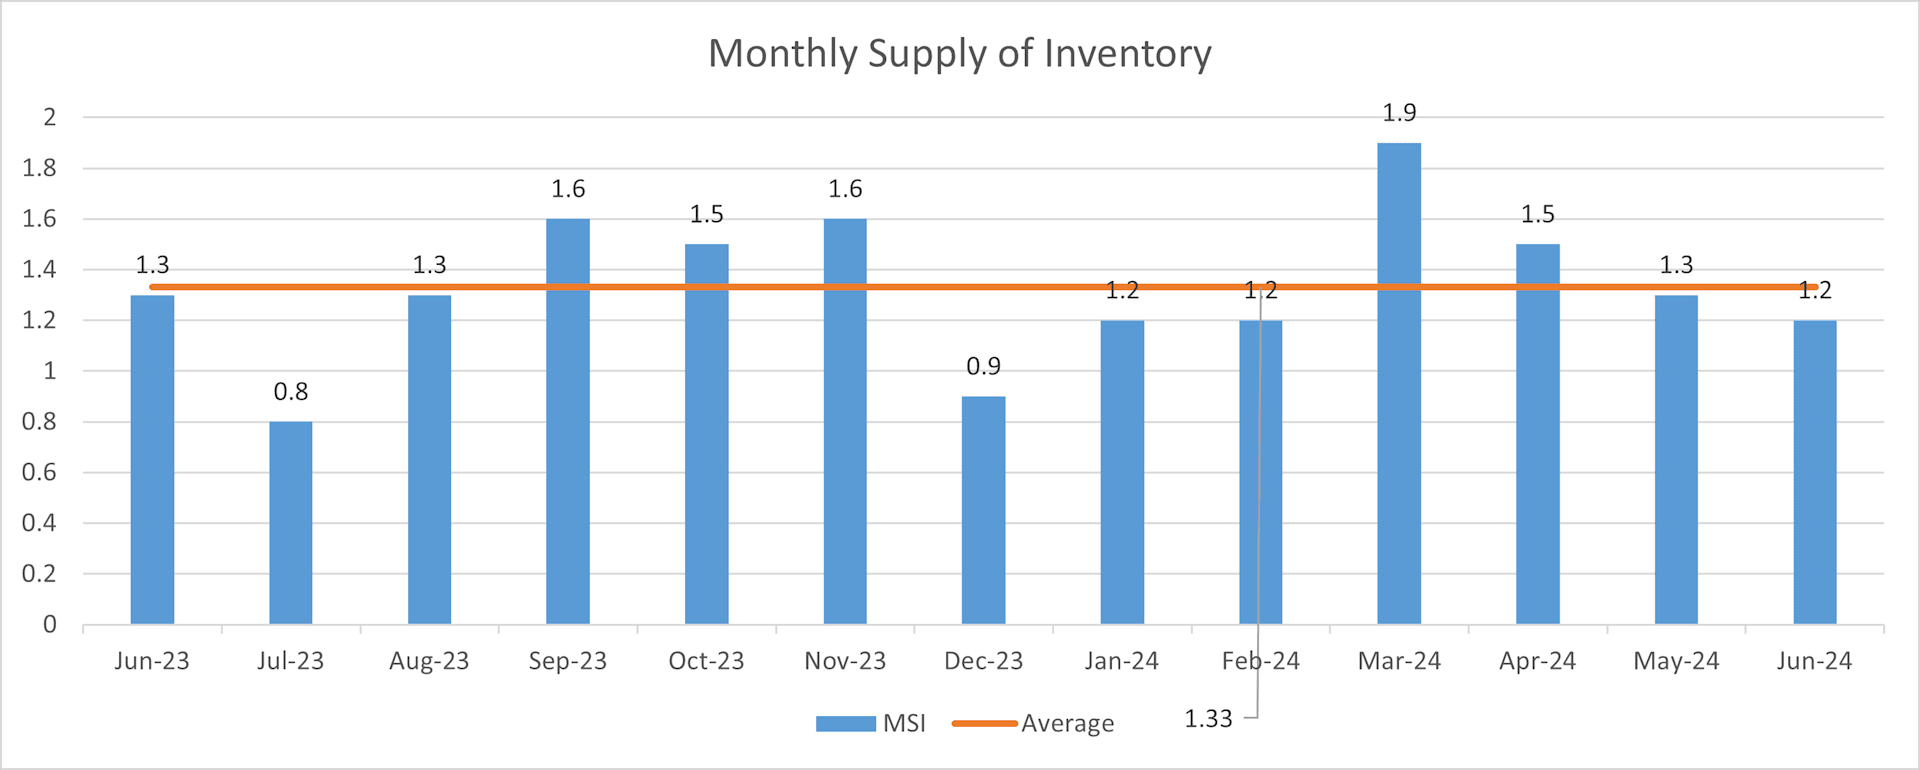
Days On Market and Monthly Supply of Inventory
When we look at the data for Days on Market (DOM) and Monthly Supply of Inventory (MSI) next to each other like this, we clearly see how they relate to one another. If a bar goes up one month on the DOM chart, it goes down that month on the MSI chart, and vice versa. This is the trend we expect to see. If we saw an increase in DOM along with a higher MSI month-over-month, that would be an indication of a change towards a buyer's market.
*All data ©BrightMLS - Information deemed reliable but not guaranteed. Data run 7/12/24.
Conclusion
Thank you for joining me with this month’s real estate market report! For the next 12 months, I’ll be bringing reports like this, school district by school district, directly to your inbox. If you know anyone who might be interested in receiving my reports, or other articles, please send them my way or share this link with them. I hope you’ve found this month’s real estate market report interesting and informative. If you’d like a better look at your neighborhood and home, I’ll always make time to help!